Sorry, you need to enable JavaScript to visit this website.
Skip to main content

Trust and confidence in the food system, health and dietary behaviours

Trust and confidence 

Generalised trust 

Scientists were the most trusted profession or institution, with 69.6% of consumers indicating trust. The school system (62.3%), police (61.9%) and the health system (59.7%) were also trusted by most consumers. The least trusted professions and institutions were the media (27.2%) and the Federal Government (Australia)/Government (New Zealand) (36.3%). 
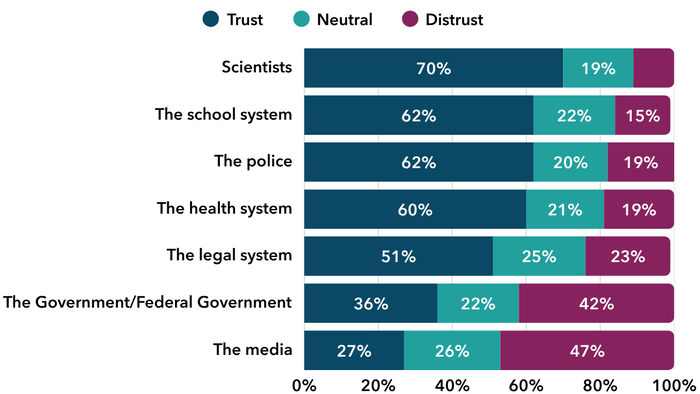
Bar chart showing trust in institutions and systems. Scientists had the highest level of trust at 70%, followed by the school system and police at 62% each, and the health system at 60%. Trust was lowest in the government at 36% and the media at 27%, with distrust exceeding trust for both.
Proportion of respondents who trust professions and institutions. Question: How much do you personally trust the following institutions or professions in Australia/New Zealand? (Seven-point scale from 1 = “Not at all” to 7 = “Completely”).

Trust in food system actors

Farmers and producers were the most trusted group in the food system, trusted by 82.8% of respondents. Food scientists were the second most trusted group (68.8%). Food retailers were the least trusted, although they were still trusted by a majority of respondents (57.3%). 
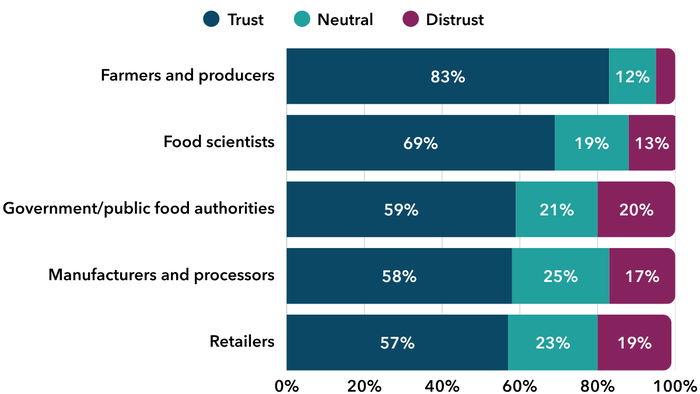
Bar chart showing trust in groups within the food system. Farmers and producers had the highest level of trust at 83%, followed by food scientists at 69%. Government or public food authorities, manufacturers and processors, and retailers had similar levels of trust, ranging from 57% to 59%.
Proportion of respondents who trust professions and institutions. Question: How much do you trust the following people or groups to do their part to ensure that all food (including drinks) sold in Australia/New Zealand shops and supermarkets is safe to eat? (Seven-point scale from 1 = “Not at all” to 7 = “Completely”).

Confidence in the safety of the food supply 

Most respondents (67.8%) were confident that food sold in Australia and New Zealand is safe to eat, while 17.1% were neutral and 15.1% were not confident. Levels of confidence have remained stable since 2023. 
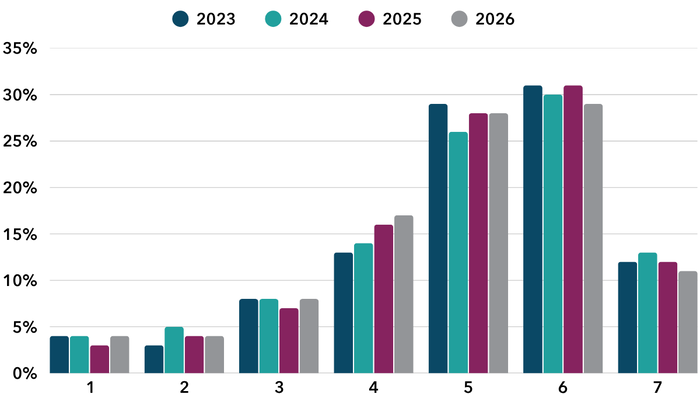
Bar chart showing ratings from 1 to 7 between 2023 and 2026. Ratings of 5 and 6 were consistently the most common, accounting for around 26% to 31% of responses. The proportion selecting 4 increased from 13% in 2023 to 17% in 2026, while ratings at either end of the scale remained relatively low.
Proportion of respondents’ level of confidence in the Australian/New Zealand food supply by year, 2023 – 2026. Question: “How confident are you that all food (including drinks) sold in Australian/New Zealand shops and supermarkets is safe to eat.” Responses were on a seven-point scale, where 1 = “Not at all confident” and 7 = “Completely confident”.

Awareness and trust of FSANZ

In 2026, almost half of respondents (47.0%) had never heard of FSANZ. A further 26.4% had heard of FSANZ but knew nothing about what it does. Almost one quarter of respondents (23.9%) knew at least a little about FSANZ, while 2.7% said they knew a lot about FSANZ and what it does. 

Question: How much, if anything, do you know about Food Standards Australia New Zealand, also known as FSANZ.
 

2023

n

(%)

2024

n

(%)

2025

n

(%) 

2026

n

(%)

I have never heard of FSANZ before

981  

(47.9) 

970  

(45.9) 

929  

(41.6) 

1,101 

(47.0) 

I have heard of FSANZ before but know nothing about what it does

545  

(26.6) 

601  

(28.4) 

633  

(28.4) 

619 

(26.4) 

I know a little about FSANZ and what it does

472  

(23.1) 

489  

(23.1) 

589  

(26.4) 

561 

(23.9) 

I know a lot about FSANZ and what it does

49  

(2.4) 

55  

(2.6) 

81  

(3.6) 

63 

(2.7) 

Among the 624 respondents who knew at least a little about FSANZ and what it does, 77% said they trust FSANZ.
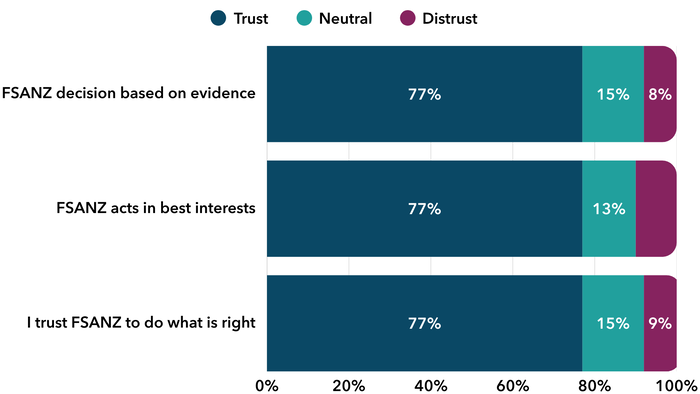
Bar chart showing trust and confidence in FSANZ. Seventy-seven per cent trusted FSANZ to base decisions on evidence, act in people’s best interests and do what is right. Distrust ranged from 8% to 10%.
Proportion of respondents’ trust in FSANZ (n = 624) Question: How much do you agree or disagree with the following statements? (In these statements, FSANZ means Food Standards Australia New Zealand) (1 = “Strongly disagree” and 7 = “Strongly agree”). Agree = score of 5, 6, 7 on the seven-point scale; Disagree = score of 1, 2, 3; Neutral = score of 4.

Health and dietary behaviours

Dietary influences

In 2026, 78.3% of respondents said at least one dietary factor influenced their food choices. Cost of living pressures have remained the biggest influence on consumers’ food choices since 2023, although the proportion of respondents citing cost of living pressures has fallen over time. 
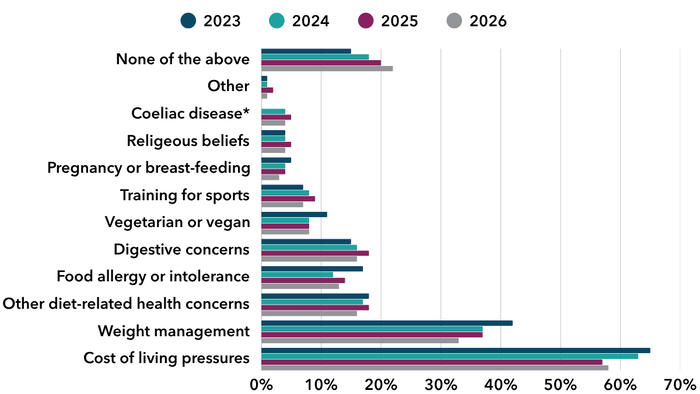
Bar chart showing factors influencing dietary choices from 2023 to 2026. Cost of living pressures were consistently the most common factor, followed by weight management. Other health and dietary factors were much less common.
Factors influencing food choices by year, 2023 – 2026. Question: Do any of the following currently affect the food choices you make for you or your household? (Please select all that apply). * Coeliac disease was grouped with all digestive concerns in the 2023 survey but was a separate response option for all other years.

Health consciousness

Most respondents (72.4%) said they make an effort to maintain a healthy diet. This has remained consistent since 2023.
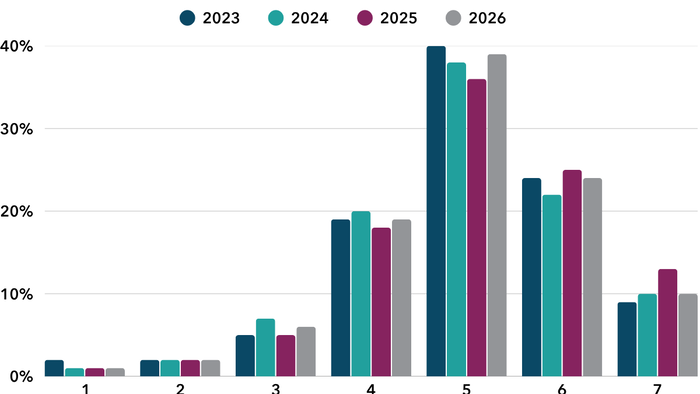
Bar chart showing health consciousness from 2023 to 2026, rated from 1 for no effort to 7 for a lot of effort in maintaining a healthy diet. A rating of 5 was most common each year, followed by 6, with results broadly consistent over time.
Proportion of respondents’ by level of health consciousness by year, 2023 – 2026. Question: How much effort do you generally put into maintaining a healthy diet for you and/or your household? 1 = “No effort”, 7 = “A lot of effort”.

Food values 

Excluding taste and price, nutrition was the most commonly selected food value, with 72.7% of respondents selecting it in their top three priorities when choosing food. This was followed by naturalness or level of processing (49.9%) and convenience (45.8%). Tradition was the least selected food value (16.5%). 
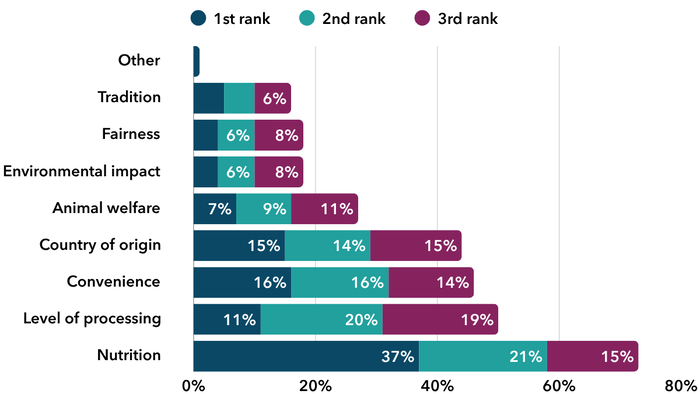
Bar chart showing factors considered when choosing food, ranked first to third. Nutrition was the leading consideration, ranked first by 37%, followed by convenience at 16% and country of origin at 15%. Level of processing was more commonly ranked second or third.
Proportion of respondents selecting each food value in their top three. Question: “Excluding taste and price, what is most important to you out of the following when choosing which foods to buy?”. 1 = most important, 2 = second most important, and 3 = third most important.


Page last updated: 26 October 2026