
2025 Key results
-
Trust in and importance of all tested labelling elements increased since 2024, except the trust in and importance of the Health Star Rating (HSR), which remained stable.
-
Consumers’ perceived confidence in their ability to use food labelling to make informed choices (M = 5.3) has also significantly increased since 2024 (M = 5.0). Most of the small number of participants who lacked confidence (n = 438) reported that it was difficult to use food labelling as they do not trust food label information; that information on a food label is too small/illegible; and that they do not understand what the information on labels means.
-
Food additives continued to be the most looked for piece of information in the ingredients list (selected by 41.0%), followed by the key ingredients (37.2%), and artificial sweeteners (33.6%).
-
Respondents’ knowledge of the NIP and HSR were both moderate to high. Australians reported a higher self-reported knowledge of both labelling elements compared to New Zealand respondents.
-
A smaller proportion of respondents were correct in selecting a product with the most energy when the NIPs displayed different serving sizes (49.3% correct) compared to when they were the same serving size (80.4%). Most participants (77.2%) selected the correct NIP when choosing which NIP displayed the least ‘salt’, or the most energy (80.4%) when the serving size was the same.
-
Most respondents use the NIP and HSR to some degree. Only 4.8% reported to never using the NIP and 12.5% to never using the HSR. The NIP was reported to be used more frequently. Australians used both labelling elements more than New Zealander respondents.
-
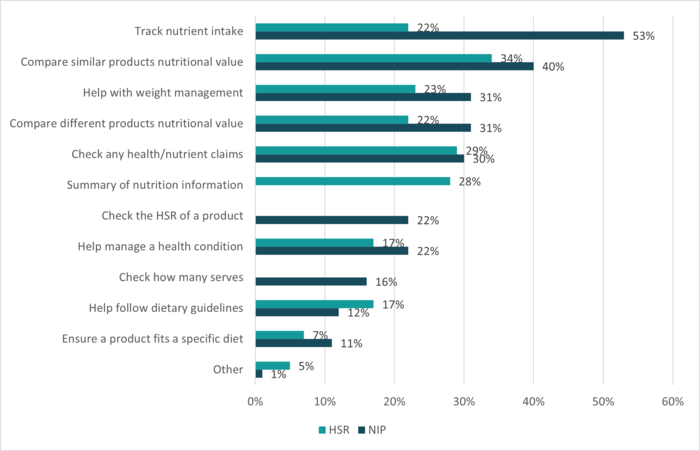
Overall, NIP and HSR users reported similar motivations for use with both commonly used to compare the nutritional value of similar products (NIP 40%; HSR 34%) and to check the basis of any health/nutrient claims (NIP 30%; HSR 29%). However, the NIP (53%) compared to the HSR (22%) is used more commonly to track nutrient intake. The HSR was also used as a summary of the nutrition information (28%).
-
More than half of consumers agreed that they would both use (58.0% agree) and trust (57.6% agree) the HSR more if it was on most food and drink products. Again, Australians reported higher results than New Zealanders on these measures.
Download the:
Trust, Use and Understanding of Food Labelling
Trust in Food Labelling
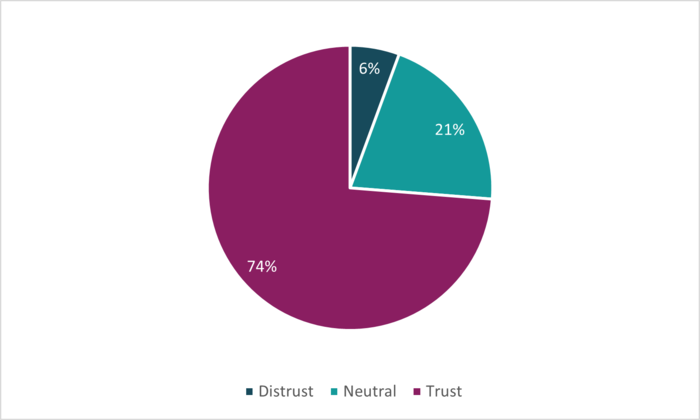
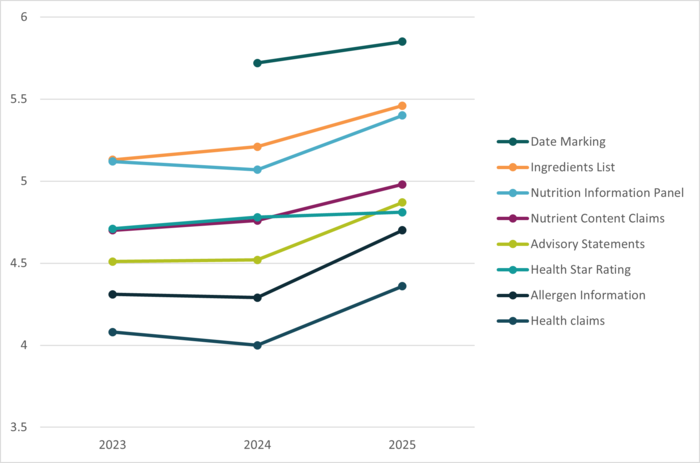
Trust in all labelling elements significantly increased between 2024 and 2025, except for the HSR, which remained steady.
73.7% of consumers trusted FSANZ regulated food labelling (all elements except for the HSR). 2025 trust in FSANZ regulated food labelling was slightly higher with a mean (M) of 5.1 than that in 2024, M = 4.9.
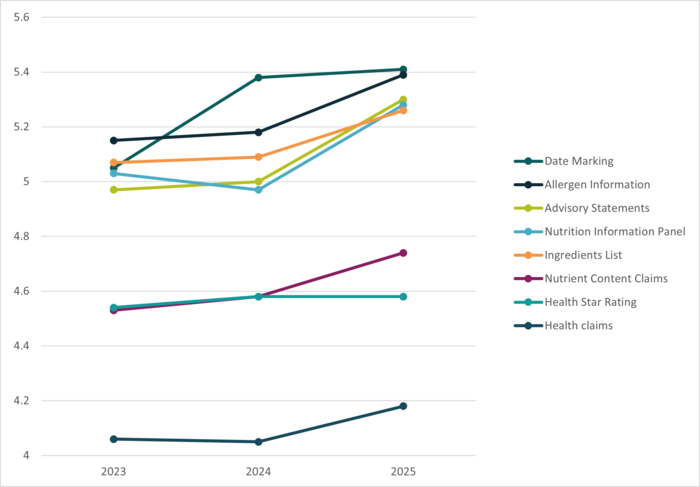
Importance of food labelling
Reflecting results for trust, the importance of all labelling elements significantly increased between 2024 and 2025, except for the HSR which remained steady.
2025 Modules: The Nutrition Information Panel (NIP) and the Health Star Rating (HSR)
Knowledge of the NIP
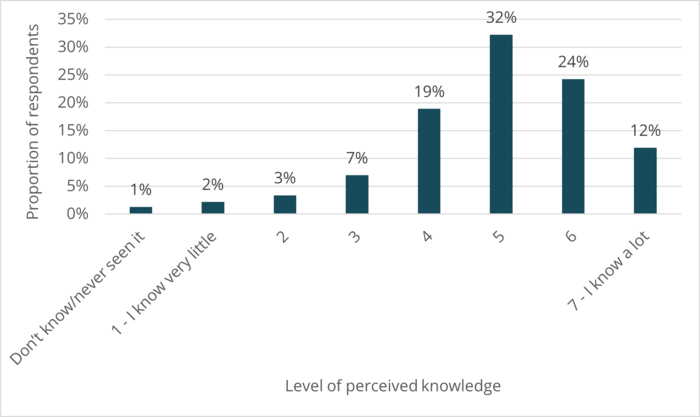
Most consumers felt that they had a moderate to high knowledge of the NIP, with 87.4% rating at least a 4 on the seven-point scale (1 = “I know very little” and 7 = “I know a lot”). Australians reported a slight but significantly higher understanding of the NIP (M = 5.0) than New Zealanders (M = 4.9).
Use of the NIP
Of those who had seen or heard of the NIP before (n = 2,204), almost half (47.9%) use the NIP ‘Always’ or ‘Most of the time’, with only 4.8% never using it. Australians reported using the NIP ‘Always’ or ‘most of the time’ more than New Zealand respondents.
|
Australia n (%) |
New Zealand n (%) |
Total n (%) |
|
|---|---|---|---|
| Always |
196 (15.2) |
104 (11.4) |
300 (13.6) |
| Most of the time |
455 (35.3) |
300 (32.8) |
755 (34.3) |
| Sometimes |
425 (32.9) |
317 (34.7) |
742 (33.7) |
| Rarely |
146 (11.3) |
130 (14.1) |
276 (12.5) |
| Never |
54 (4.2) |
52 (5.6) |
106 (4.8) |
| Unsure |
14 (1.1) |
11 (1.2) |
25 (1.1) |
Elements within the NIP
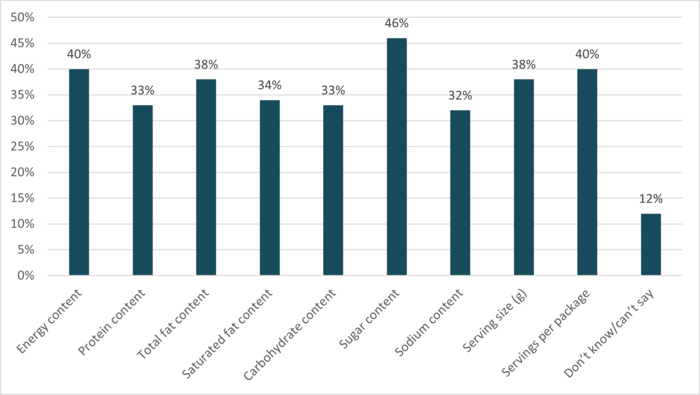
Sugar content was the piece of information most frequently referred to on the NIP. This was followed by energy content, servings per package, total fat content per serving and serving size. Overall, information on nutrients (e.g. sugar and fat) per serve were more commonly referred to than per 100g or the %DI.
Understanding of the NIP
Participants were asked to complete several tasks to measure their understanding of the NIP. A smaller proportion of respondents were correct in selecting a product with the most energy when the NIPs displayed different serving size (49.3% correct) compared to when they were the same serving size (80.4%). Most participants (77.2%) selected the correct NIP when choosing which NIP displayed the least ‘salt’, or the most energy (80.4%) when the serving size was the same.
|
Correct answer n (%) |
Incorrect answer n (%) |
Answered that both products have the same amount of energy/salt n (%) |
Don’t know n (%) |
|
|---|---|---|---|---|
| Different serving size | ||||
| Most energy |
1,100 (49.3) |
858 (38.4) |
108 (4.8) |
166 (7.4) |
| Same serving size | ||||
| Most energy |
1,794 (80.4) |
202 (9.1) |
89 (4.3) |
128 (6.3) |
| Less salt |
1,723 (77.2) |
246 (11.0) |
89 (4.0) |
174 (7.8) |
Knowledge of the HSR
Most consumers felt that they had a moderate to high knowledge of the HSR, with 77.0% rating at least a 4 on the seven-point scale (1 = “I know very little” and 7 = “I know a lot”). Only 1.4% did not know what the HSR was or had never seen it before. Australians reported a significantly higher understanding of the HSR than New Zealanders on average. However, self-reported knowledge may not reflect objective understanding.
|
Australia Mean (±SD) |
New Zealand Mean (±SD) |
Total Mean (±SD) |
|
|---|---|---|---|
| Self-reported knowledge of the HSR |
4.6 (1.4) |
4.2 (1.5) |
4.5 (1.5) |
Use of the HSR
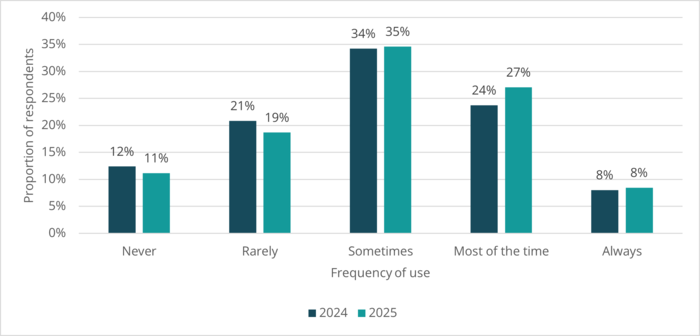
Of those who had seen or heard of the HSR before in 2025 (n = 2,200), 35.3% use the HSR ‘Always’ or ‘Most of the time’, with 11.1% never using it. There was no difference in reported use between 2024 and 2025. Australians reported using the HSR more frequently than New Zealand respondents in 2025.
Motivations for using the HSR and NIP
Overall, the NIP and HSR are both commonly used to compare the nutritional value of similar products and to check the basis of any health/nutrient claims. However, the NIP compared to the HSR is more commonly used to track nutrient intake and the HSR is used as a summary of nutrition information found on the back of pack.
Potential Mandating of the HSR
More than half of consumers agreed that they would both use (58.0% agree) and trust (57.6% agree) the HSR more if it was on most food and drink products. Australian use and trust were both higher relative to New Zealand.
|
Australia Mean (±SD) |
New Zealand Mean (±SD) |
Total Mean (±SD) |
|
|---|---|---|---|
| Use the HSR if it was on most products |
4.8 (1.7) |
4.4 (1.9) |
4.6 (1.8) |
| Trust the HSR more if it was on most food and drink products |
4.8 (1.6) |
4.4 (1.8) |
4.6 (1.7) |