2025 Key insights
- More than half of respondents (58%) had shopped for food/drink online via various online platforms in the past 30 days. A higher proportion of Australians (62.9%) than New Zealanders (50.4%) reported using any online platform.
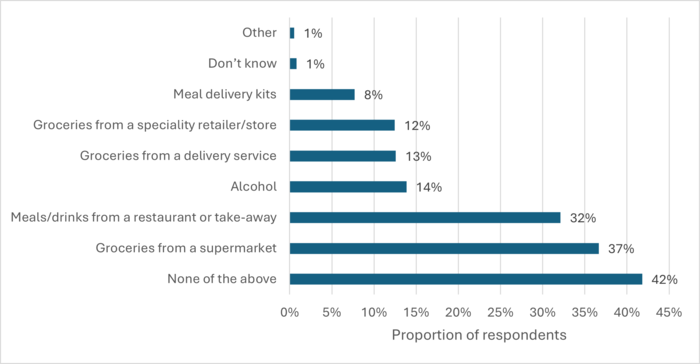
- Supermarket grocery shopping (36.8%) and ordering meals or drinks from a restaurant or take‑away (32.4%) were the most reported online services used. Smaller proportions of respondents reported using online platforms to order alcohol (14.0%), groceries from a delivery service (12.8%), groceries from a speciality retailer (12.8%), and meal delivery kits (8.1%).
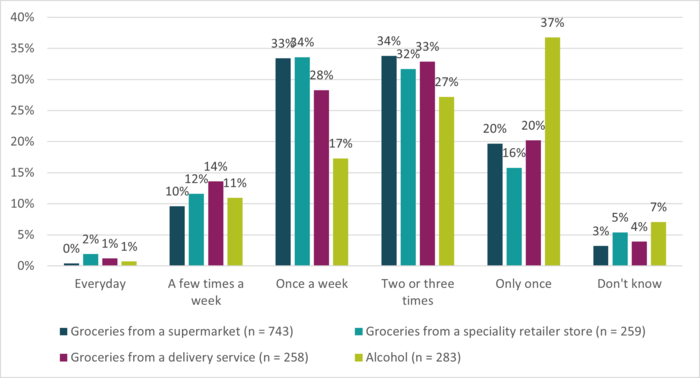
- Ordering groceries ‘once a week’ or ‘two or three times’ in the past 30 days was the most common frequency of use (28 to 34% depending on online platform). Alcohol was ordered less frequently, with 37% of respondents having done so ‘only once’ in the same period. Everyday purchasing was rare across all categories.
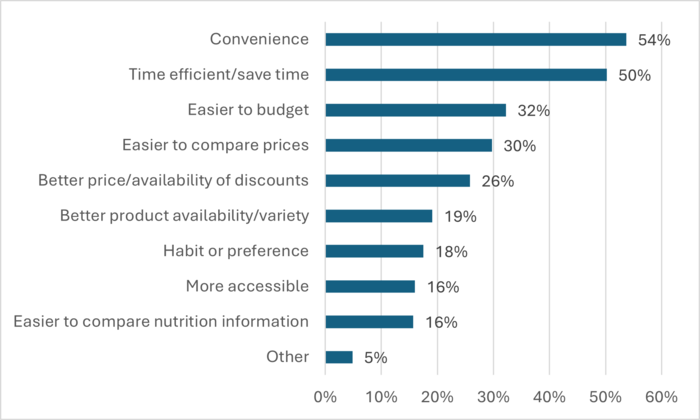
- Convenience was the most reported motivation for ordering groceries from a supermarket online (53.7%), followed by efficiency and time saving (50.2%) and ease of budgeting (32.2%).
- When shopping online, price was the information respondents sought most (70.9%), followed by the ingredients list (34.9%) and the Nutrition Information Panel (32.1%).
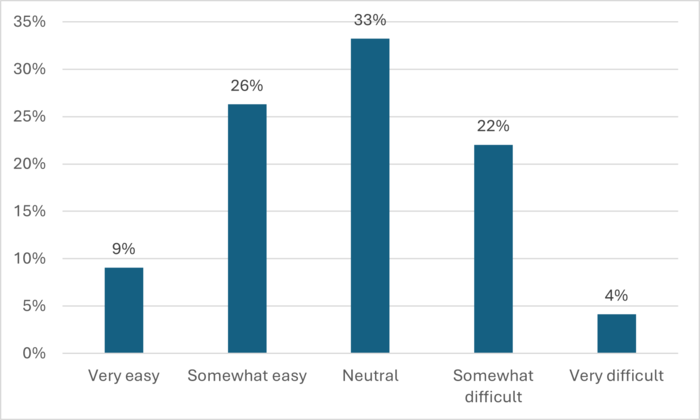
- Just over a quarter of respondents (26.1%) reported finding it difficult to find nutrition information when shopping for food/drink online. Similar proportions of respondents reported that it was either easy (35.4%) or neither hard nor easy (33.2%). And 5.3% do not look for this type of information.
Download the:
Use of online food shopping
Fifty-eight percent of respondents reported using at least one of the listed online platforms to order food or drinks in the past 30 days. Among those who reported doing so, the most reported online food service was ordering groceries from a supermarket, with just over a third of respondents having used this platform in the past 30 days (36.7%).
Ordering groceries ‘once a week’ or ‘two or three times’ in the past 30 days was the most common frequency of use. However, alcohol was ordered less frequently with the most selected response being ‘only once’ in the same period.
Online food shopping motivations
Groceries online from a supermarket
Convenience was the most reported motivation for ordering groceries from a supermarket online or using a mobile app (53.7%; n = 743). This was followed by efficiency and time saving (50.2%) and ease of budgeting (32.2%).
Groceries online from a specialty retail store
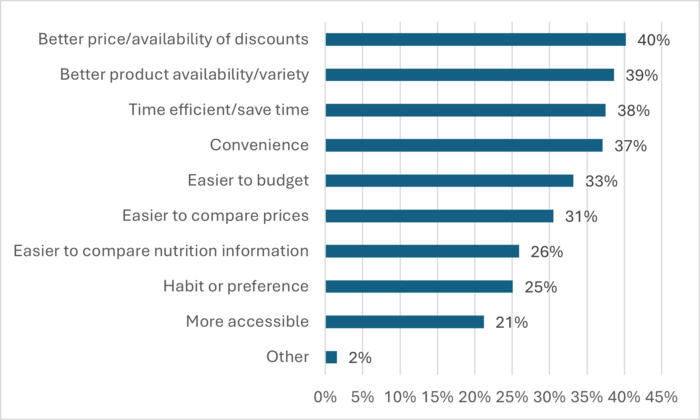
For respondents who had ordered groceries online from a specialty retail store, better price and availability of discounts was the most commonly cited motivation (40.2%; n = 259), closely followed by better product availability and variety (38.6%) and efficiency and time saving (37.5%).
Groceries from an online delivery service
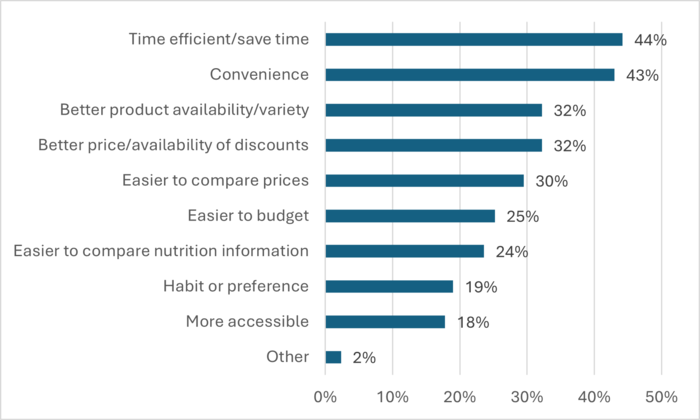
Among respondents who had ordered groceries online using a delivery service (e.g. Amazon, Milkrun), efficiency and time saving was the most commonly cited motivation (44.2%; n = 258), followed closely by convenience (43.0%). Better price and availability of discounts and better product availability and variety were the third most selected motivations (both 32.2%).
Alcohol ordered online
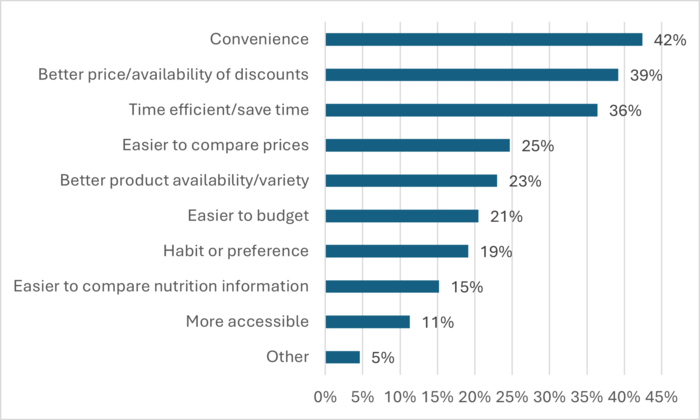
For online or mobile app alcohol purchases, convenience was most commonly cited motivation (42.4%; n = 283), followed by better price and availability of discounts (39.2%) and efficiency and time savings (36.4%).
Use and availability of online food product information
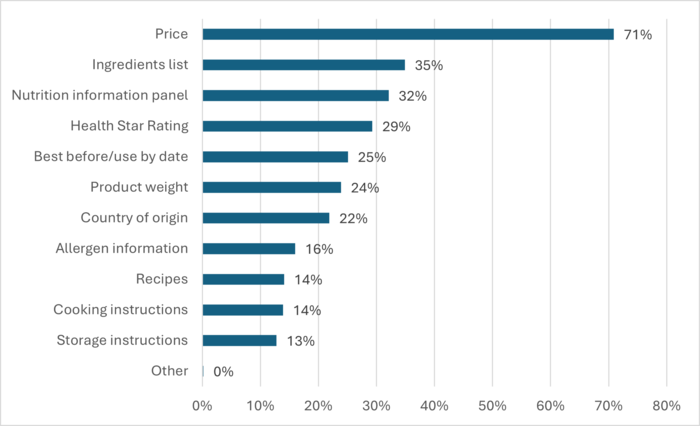
Price was the most commonly sought piece of information when shopping for food and drink online (70.9%), followed by the ingredients list (34.9%), and the Nutrition Information Panel (32.1%).
Thirty-five percent of respondents found it least somewhat easy to find nutrition information, while 26.1% found it ‘somewhat difficult’ or ‘very difficult’. Thirty-three percent selected a neutral response and 5.3% do not look for this type of information.
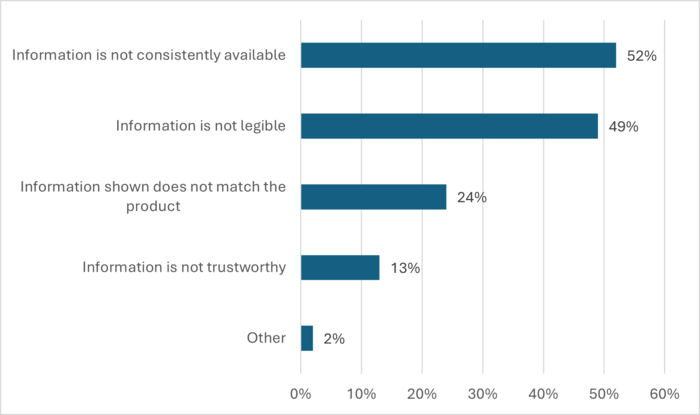
Among respondents who found it somewhat or very difficult to find nutrition information when shopping for groceries online, the most commonly cited reason for this was inconsistent availability of information (52.1%), closely followed by poor legibility (48.7%).