2025 Key insights
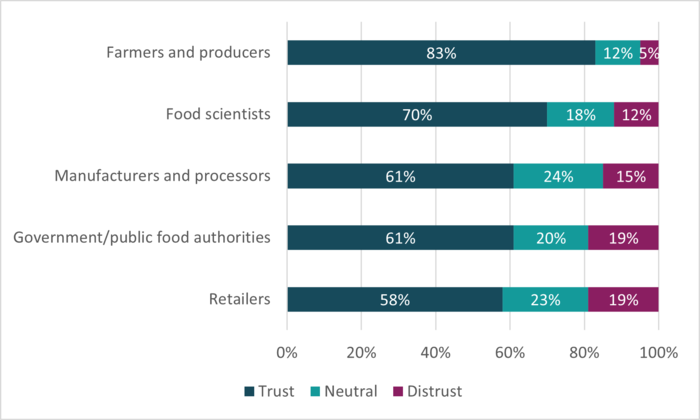
- Farmers and producers are the most trusted part of the food system, with 83% of consumers saying they trust them.
- Seven in 10 people (70.3%) are confident that food sold in Australia and New Zealand is safe to eat. This confidence has remained steady since 2023.
- Among people who are aware of FSANZ, around 78% trust FSANZ. Trust levels have not changed since 2023.
- Cost of living continues to be the biggest factor influencing food choices, with 57% of consumers reporting it as a key influence. After taste and price, nutrition is the most important food value, rated as important by 75% of consumers.
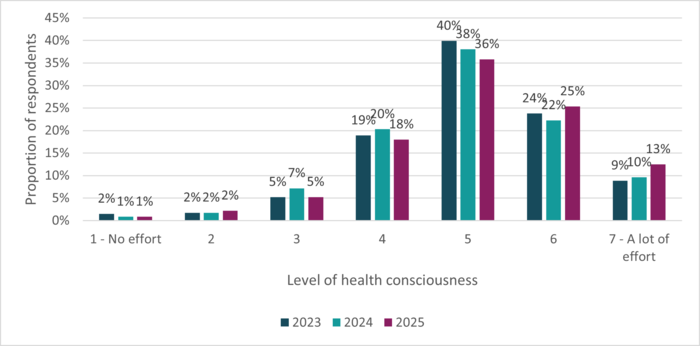
- Most people (74%) say they make an effort to maintain a healthy diet, consistent across all survey years.
Download the:
Trust and confidence
Generalised trust
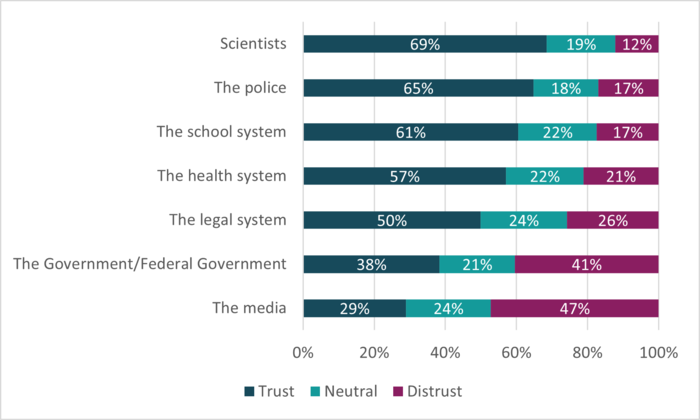
Scientists were the most trusted profession/institution, with 68.5% of consumers indicating trust (through selecting a rating of 5 to 7 on a seven-point scale), followed by the police (64.8%). The least trusted professions/institutions were the media (28.9%) and the Federal Government (AU)/Government (NZ) (38.4%).
Trust in food system actors
Farmers and producers were the most trusted group in the food system. They were trusted (scored above the midpoint) by 82.9% of respondents. The least trusted were food retailers, trusted by 57.8% of respondents.
Confidence in the safety of the food supply
The majority of respondents in 2025 (70.3%) were confident (rating above the midpoint) that food sold in Australia and New Zealand is safe to eat, 16.3% were neutral and 13.4% were not confident. Level of confidence in food supply has remained steady since 2023.
Awareness and trust of FSANZ
In 2025, 41.6% of respondents had never heard of FSANZ before, 28.4% had heard of FSANZ before but knew nothing about what it does, 26.4% knew at least a little about FSANZ and what it does, and 3.6% knew a lot about FSANZ and what it does. Awareness has remained the same since 2023.
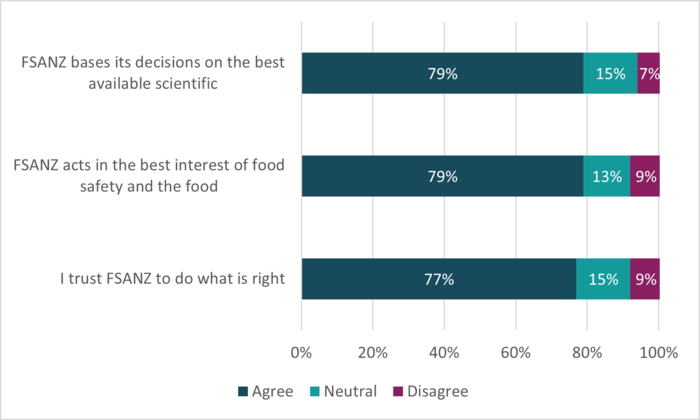
The majority of respondents who knew about FSANZ trusted FSANZ. Of the three trust items, the proportion who trusted FSANZ ranged from 77 – 79%.
Health and dietary behaviours
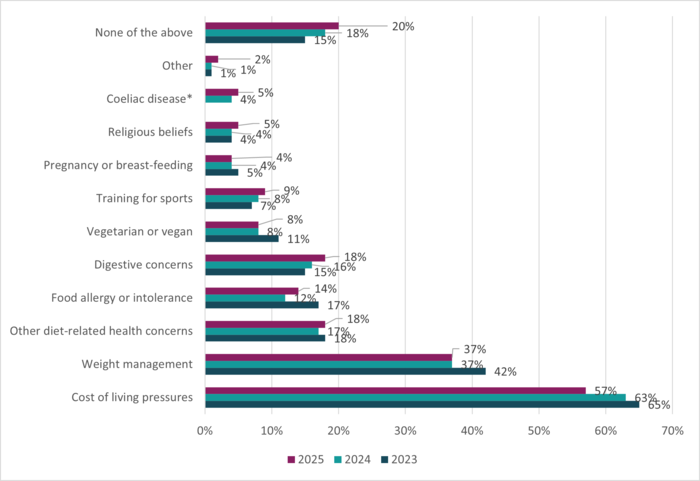
Dietary influences
In 2025 80.0% of respondents had at least one dietary factor influencing their food choices. For all years (2023 to 2025), the most important factor influencing consumers’ food choices was cost of living pressures (selected by 57% in 2025).
Food values
Excluding taste and price, nutrition was the most frequently selected food value, with 75% of respondents selecting it in their top three. This is consistent with respondents top three food values of 2024 and 2023.